

.svg)
.jpeg)
Reporting for Shortcut: Now in Beta!
Software development teams of all sizes use Shortcut to manage their projects and check the status of their efforts. However, in deeper conversations with users over the past few months, it became clear that managers and tech leads want to see not just the status of projects but their trends, too.
So we got busy developing date-based reporting, in the hope that these new visualizations of your work could enable you to dig into what is getting done, what isn’t, and how to get (or stay!) on track.
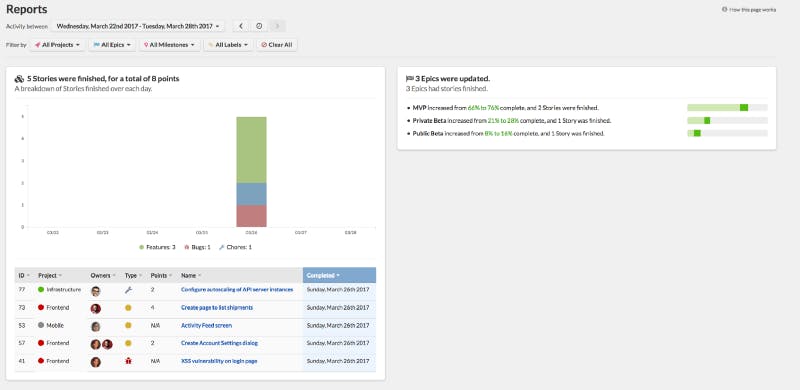
The Reports Page (click on image to learn more)
Reports on completed Stories and Epics can be viewed on the Reports page and scoped to a custom timeframe or a specified iteration. Once your standard iteration start date and length is set, you can easily navigate through past iterations using iterations using the arrow button on the page
Stakeholders across the organization — such as product managers, project managers, and CTOs — want to be able to quickly grab project status, identify/unclog bottlenecks, and make sure projects are moving at the expected pace.
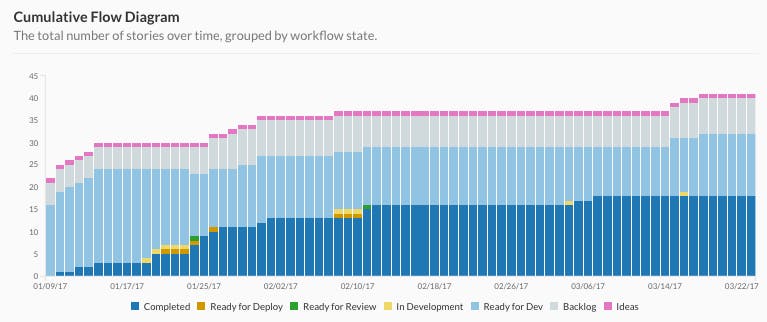
While Shortcut has long had Cumulative Flow Diagrams (“burnup charts”) to identify where in the workflow efforts may be backed up, we’ve now also added Epic Burndown and Milestone Burndown charts.
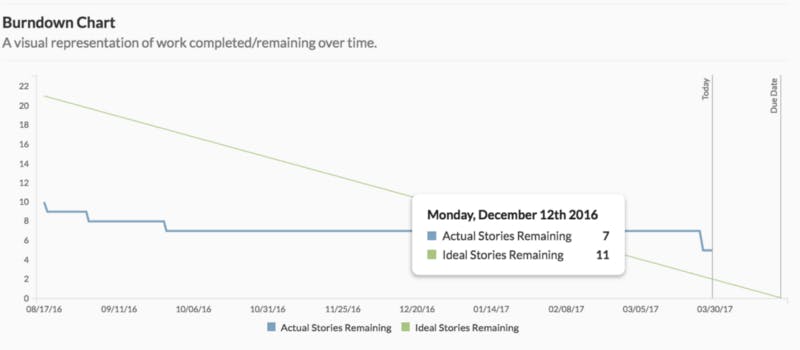
When an Epic has a due date selected, you can check out the Epic Burndown Chart in the selected Epic’s Report tab to quickly view whether production is likely to meet your delivery date. When a due date is not specified, the chart provides a predicted end date based on your team’s current calculated velocity. The Cumulative Flow Diagram can also now be found in the Epic Reports tab.
On the Milestone Burndown Chart, you can track completion of associated Stories and Epics and see a predicted end date, which is determined using the current calculated velocity.
This is just the beginning. These reports are all still very much in beta for the time being because there is still a bit more polishing/tweaking/bug-smashing to do, and — as always — we need your continued feedback about what you want/need to see.
Not all data visualizations are useful, and you don’t just want charts for charts’ sake. So, what would help you streamline your process, do your best work, and wow your customers? Let us know!